


SV or Excel file containing your data into Chartify. It could be sales data, inventory data or any other type of data. Chartify's AI algorithms will automatically generate a range of charts based on your data. 2. Ask anything Simply type in a question or statement about your data, and Chartify's AI will understand your intent, and generate charts that answer your question. For example, you could ask, "Show me the sales growth of my top 5 products in the last year." 3. Get beautiful charts Chartify generates visually stunning charts that are easy to interpret and share. All charts are customizable, so you can change colors, fonts, labels, and more to match your brand or personal preferences. Chartify is ideal for business owners, data analysts, and anyone who works with data regularly. With Chartify, you can quickly and easily analyze your data and make informed decisions. The best part is that you don't need any technical skills to use it. Try Chartify today and see how it can transform your data analysis process.
电脑端截图
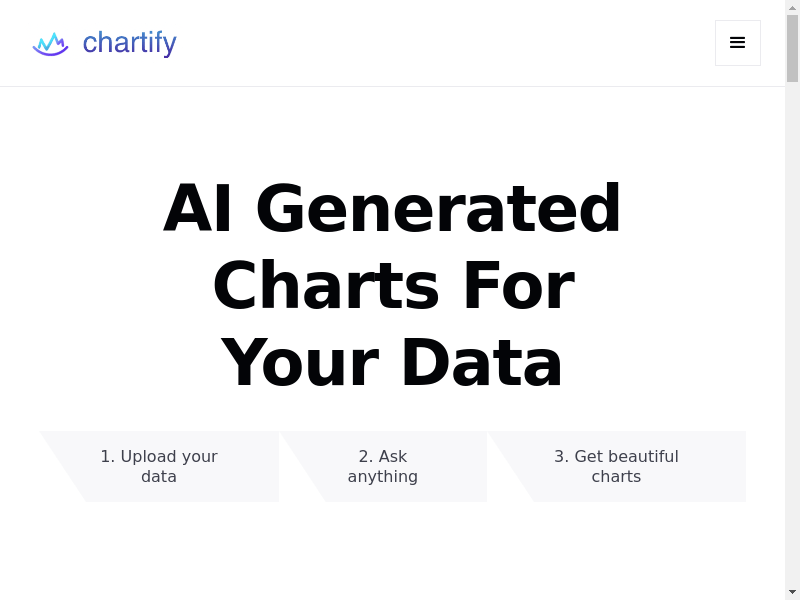
移动端截图